substack.com - Clouded Judgement 1.23.26 - The Year of Multi-Modal
Every week sI’ll provide updates on the latest trends in cloud software companies. Follow along to stay up to date!
The Year of Multi-Modal
I have a growing conviction that 2026 will be the year of multi modal AI. There are a handful of trends all coming together at the same time that are set to converge. Multi-modal models get good enough. Inference is getting cheaper and faster (cost curve is important). And the real world starts showing up as first class input. I really believe AI will stop predominantly living in text boxes and instead in places humans actually are.
For the last few years, AI has been overwhelmingly text first, and for good reason. Text was the fastest path to usefulness. It was easy to collect, easy to tokenize, relatively cheap to serve, and generally didn’t have the same latency requirements. If you were building an AI product in 2023 or 2024, starting with text was the rational choice. But text always seemed like a middle state, not an end state. Humans do not experience the world in text. Work does not happen in text. The physical world certainly does not operate in text. Multi modal AI was always where this was heading. And I think we’re close!
What feels different now is how suddenly the pieces are snapping into place. Just in the last week, we saw a wave of production grade text to speech models that would have felt experimental not long ago. NVIDIA PersonaPlex is a good example of how expressive and controllable synthetic voices have become, especially for characters and agents. Inworld TTS also had a release, and it’s clearly optimized for low latency, interactive dialogue rather than polished narration. Flashlabs Chroma 1.0 shows how quickly open ecosystems are closing the quality gap. And Alibaba Qwen3 TTS reinforced that this is global and competitive, not confined to a single lab or market. Voice is just one modality, but it is a useful signal that something broader is happening.
At the same time, inference economics are finally catching up, and cost curves are bending. Multi modal AI was more impractical than impossible. Latency was too high. Costs were too unpredictable. Systems were too brittle to trust in real world workflows. That is changing fast. Inference engines are getting more efficient. GPUs are being utilized more effectively. Batching, speculative decoding, and modality specific optimizations are pulling costs down and smoothing tail latency. Teams are also getting more comfortable deploying smaller, specialized models for vision, audio, or sensor data instead of forcing everything through one massive general purpose model. The result is that multi modal inference is no longer something you budget for cautiously but have to confine to smaller audiences or test cases. It’s going mainstream!
The third piece is that the world itself is becoming legible to machines. Cameras, microphones, wearables, industrial sensors, cars, robots, and medical devices are producing continuous streams of data that finally have models capable of understanding them in real time. This unlocks entire categories that text only AI could never reach. Physical environments. Always on monitoring. Workflows that unfold continuously rather than one prompt at a time. Once AI can see, hear, and react, it really can take the next leap in functioanlity.
This is why 2026 matters specifically. All of these trends are converging together. By 2026, model quality is no longer the gating factor for most multi modal use cases. Inference cost and latency are low enough that always on perception is viable. And distribution increasingly shows up through agents, devices, vehicles, and embedded systems rather than chat interfaces. At that point, multi modal can step into the limelight and become a first class citizen. Text only AI will start to feel oddly constrained, the same way desktop only software felt once mobile became ubiquitous.
The mistake is to think of this shift as simply text plus voice, or LLMs plus vision. The deeper change is that AI systems are beginning to experience the world the way humans do. Through multiple senses, continuously, and in context. Text was the on ramp, and 2026 is when AI finally leaves the keyboard! I’m excited for that future
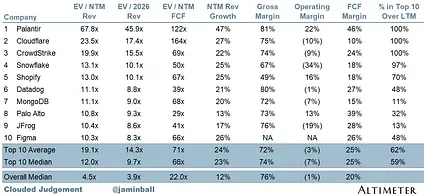
Top 10 EV / NTM Revenue Multiples
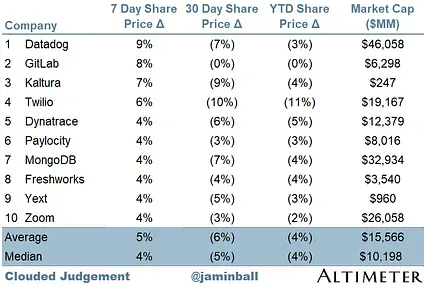
Top 10 Weekly Share Price Movement
Update on Multiples
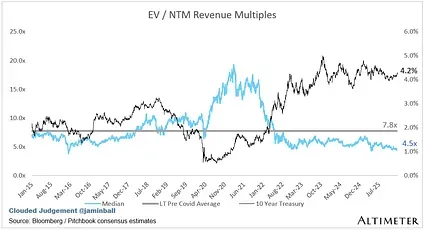
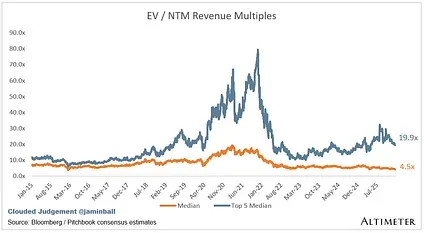
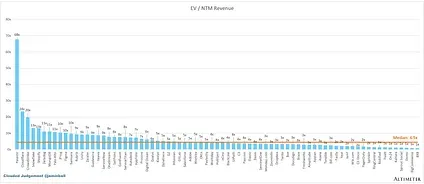
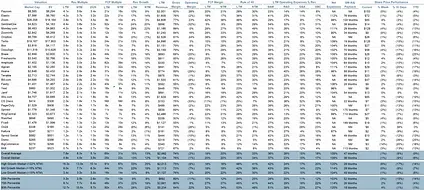
SaaS businesses are generally valued on a multiple of their revenue - in most cases the projected revenue for the next 12 months. Revenue multiples are a shorthand valuation framework. Given most software companies are not profitable, or not generating meaningful FCF, it’s the only metric to compare the entire industry against. Even a DCF is riddled with long term assumptions. The promise of SaaS is that growth in the early years leads to profits in the mature years. Multiples shown below are calculated by taking the Enterprise Value (market cap + debt - cash) / NTM revenue.
Overall Stats:
- Overall Median: 4.5x
- Top 5 Median: 19.9x
- 10Y: 4.2%
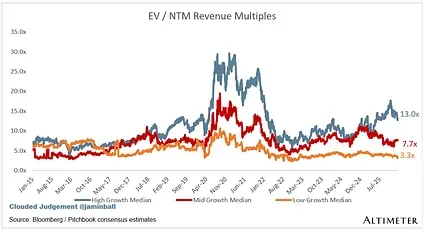
Bucketed by Growth. In the buckets below I consider high growth >22% projected NTM growth, mid growth 15%-22% and low growth <15%. I had to adjusted the cut off for “high growth.” If 22% feels a bit arbitrary, it’s because it is…I just picked a cutoff where there were ~10 companies that fit into the high growth bucket so the sample size was more statistically significant
- High Growth Median: 13.0x
- Mid Growth Median: 7.7x
- Low Growth Median: 3.3x
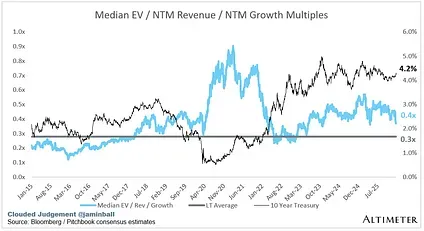
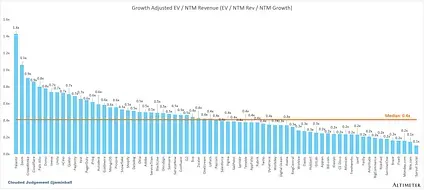
EV / NTM Rev / NTM Growth
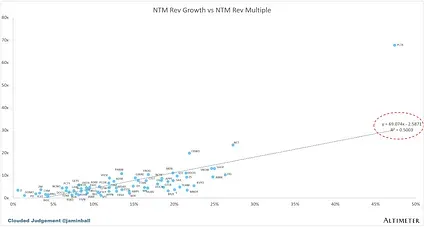
The below chart shows the EV / NTM revenue multiple divided by NTM consensus growth expectations. So a company trading at 20x NTM revenue that is projected to grow 100% would be trading at 0.2x. The goal of this graph is to show how relatively cheap / expensive each stock is relative to its growth expectations.
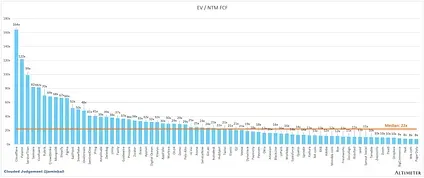
EV / NTM FCF
The line chart shows the median of all companies with a FCF multiple >0x and <100x. I created this subset to show companies where FCF is a relevant valuation metric.
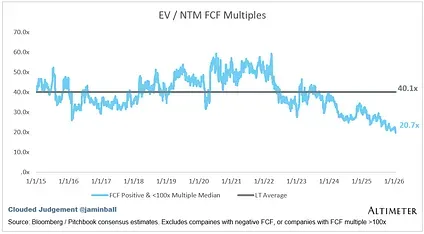
Companies with negative NTM FCF are not listed on the chart
Scatter Plot of EV / NTM Rev Multiple vs NTM Rev Growth
How correlated is growth to valuation multiple?
Operating Metrics
- Median NTM growth rate: 12%
- Median LTM growth rate: 13%
- Median Gross Margin: 76%
- Median Operating Margin (1%)
- Median FCF Margin: 20%
- Median Net Retention: 108%
- Median CAC Payback: 36 months
- Median S&M % Revenue: 37%
- Median R&D % Revenue: 23%
- Median G&A % Revenue: 15%
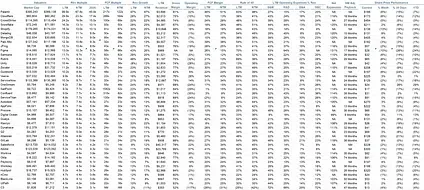
Comps Output
Rule of 40 shows rev growth + FCF margin (both LTM and NTM for growth + margins). FCF calculated as Cash Flow from Operations - Capital Expenditures
GM Adjusted Payback is calculated as: (Previous Q S&M) / (Net New ARR in Q x Gross Margin) x 12. It shows the number of months it takes for a SaaS business to pay back its fully burdened CAC on a gross profit basis. Most public companies don’t report net new ARR, so I’m taking an implied ARR metric (quarterly subscription revenue x 4). Net new ARR is simply the ARR of the current quarter, minus the ARR of the previous quarter. Companies that do not disclose subscription rev have been left out of the analysis and are listed as NA.
Sources used in this post include Bloomberg, Pitchbook and company filings
The information presented in this newsletter is the opinion of the author and does not necessarily reflect the view of any other person or entity, including Altimeter Capital Management, LP (“Altimeter”). The information provided is believed to be from reliable sources but no liability is accepted for any inaccuracies. This is for information purposes and should not be construed as an investment recommendation. Past performance is no guarantee of future performance. Altimeter is an investment adviser registered with the U.S. Securities and Exchange Commission. Registration does not imply a certain level of skill or training. Altimeter and its clients trade in public securities and have made and/or may make investments in or investment decisions relating to the companies referenced herein. The views expressed herein are those of the author and not of Altimeter or its clients, which reserve the right to make investment decisions or engage in trading activity that would be (or could be construed as) consistent and/or inconsistent with the views expressed herein.
This post and the information presented are intended for informational purposes only. The views expressed herein are the author’s alone and do not constitute an offer to sell, or a recommendation to purchase, or a solicitation of an offer to buy, any security, nor a recommendation for any investment product or service. While certain information contained herein has been obtained from sources believed to be reliable, neither the author nor any of his employers or their affiliates have independently verified this information, and its accuracy and completeness cannot be guaranteed. Accordingly, no representation or warranty, express or implied, is made as to, and no reliance should be placed on, the fairness, accuracy, timeliness or completeness of this information. The author and all employers and their affiliated persons assume no liability for this information and no obligation to update the information or analysis contained herein in the future.