lukew.com - LukeW Showing the Work of Agents in UI
As AI products lean more heavily into agentic capabilities, the same design challenges keep surfacing across projects. Here’s a look at how we’ve approached one of these recurring debates: showing the work of agents, or not.
An AI product becomes agentic when the model doesn’t just respond to a prompt, but plans which tools to use, configures them, and decides its next steps based on the results. This additional set of process means AI products are able to do more, check their work, and thereby provide better results. The downside, though, is it can be a lot for people to take in.
Whether people are using agentic products for coding, data analysis, or writing, I keep seeing the same split: some users find the agent’s work overwhelming and want the interface to focus purely on results. Others say seeing that work is essential for monitoring and checking what the agent is doing. Strongly worded feedback comes in from both sides.
I initially assumed this was a temporary divide. New users tend to watch closely and check the system’s progress, but as trust builds, that scrutiny fades and monitoring starts to feel like a chore. Yet it still seems like there’s two camps (for now). So how does a product strike the balance?
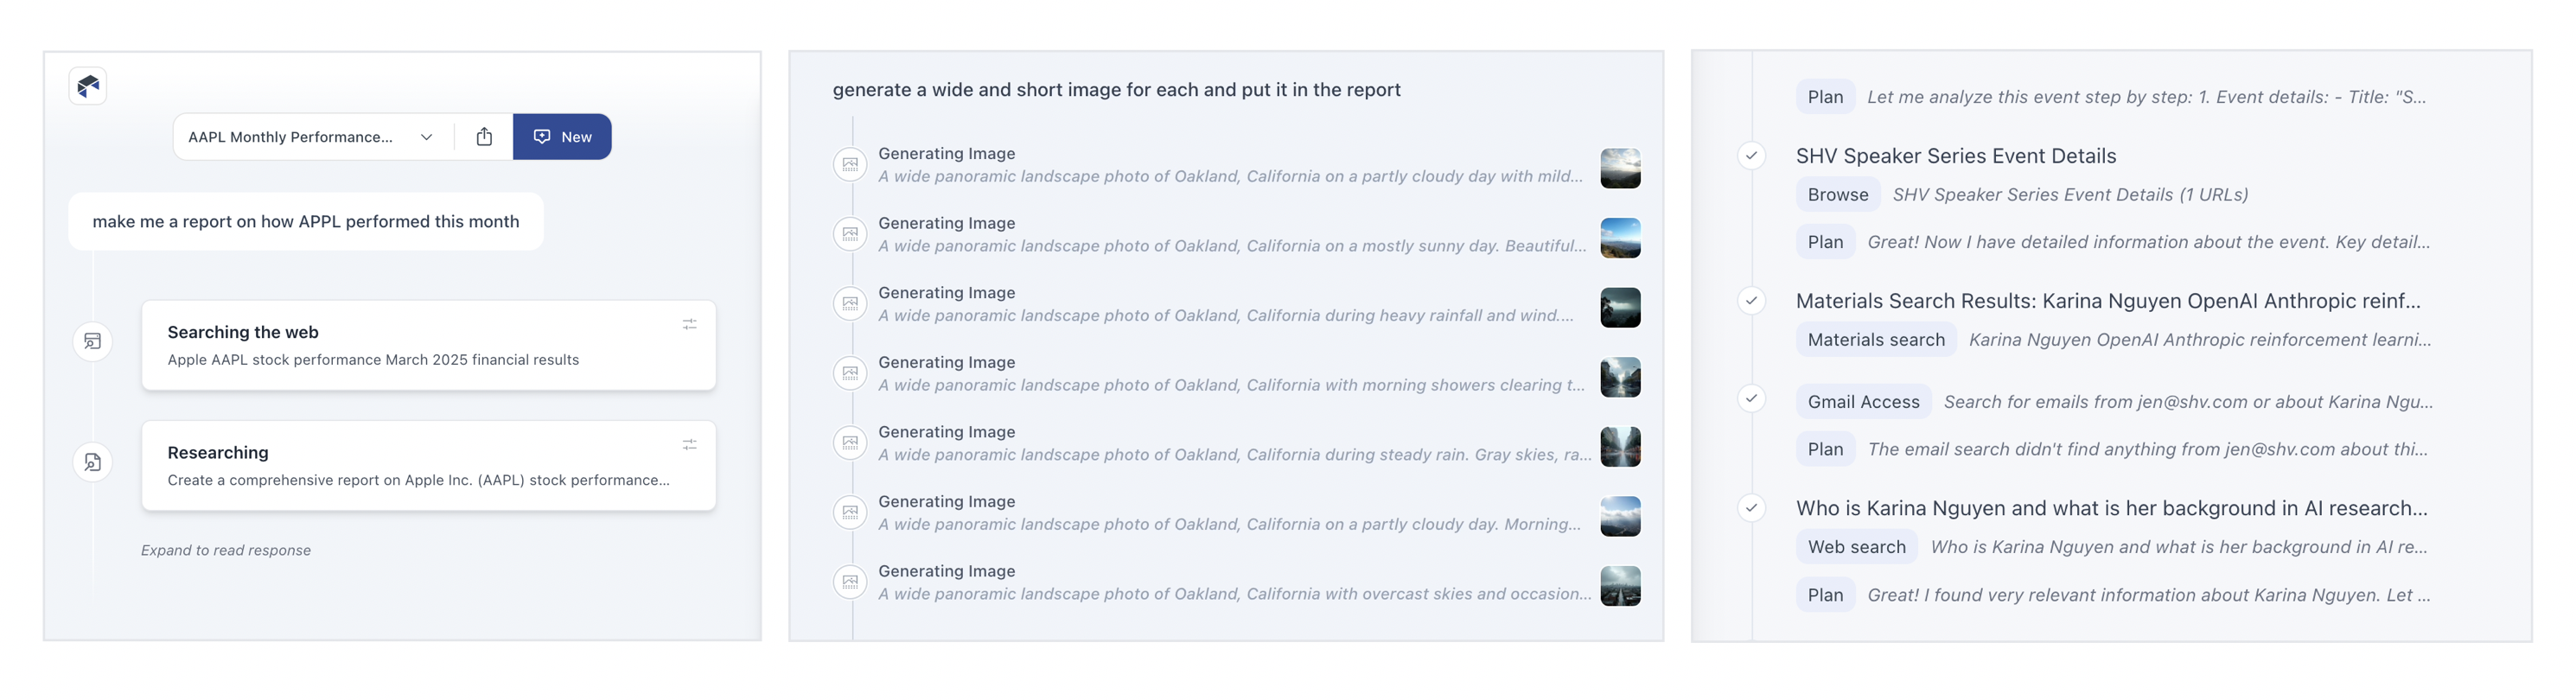
When working on Bench, a workspace for knowledge work, we explored many approaches to displaying tool use, results, and configuration. (though we quickly learned, no one configured tools, that’s the agent’s job.) In this exploration, results from each tool are grouped beneath it and open in the right column when selected (video below).
A later iteration featured several levels of progressive disclosure. Tool calls were collapsed by default, and selecting one would show its results in the right column. Selecting the timeline highlighted all the process and decision points between tool uses. You could even open each tool’s settings, re-run it, or stop it mid-execution (video below). Tools were new back then and we were working off the assumption that people would want visibility and control. It was too much.
In subsequent iterations we focused on reducing the visual weight of tools and showing less process by default. This became even more important as the number of tools grew..
For ChatDB, which helps people understand and visualize data, we split the interface into two columns. While the agent works (video below), the left side shows what it’s doing: the decisions it’s making, the tools it’s picking, and so on. When results appear in the right column, the left side collapses down to a summary and link so the focus shifts to the output. Anyone who wants to review the steps can open it back up.
This approach allows the agent’s work to serve a detailed progress indicator, instead of forcing people to watch a spinner while things work.
More recently in Intent, a developer workspace for working with agents, we used a single line to show an agent’s work with the ability to expand it for more details. It’s an attempt to strike a balance between too much and not enough but I still hear opinions on both sides.